Visualisation of Celestial Bodies in our Solar System
By Pius Whande and Matthew WilliamsIntroduction
"Space, the next frontier". Our interests are piqued at this view of our world beyond Earth's space; as a boundary between the explored and the unexplored. It forms a contradiction with the space missions over time, but also proves true in the fact we have not yet settled in the parts we have explored. Throughout history, man has been known to seek that which is beyond their current means, and as of now, space is one of the biggest frontiers. Like any other frontier, there is a possibility that the world we seek beyond the confines of Earth might contain other intelligent lifeforms, or lifeforms of any kind, and so we find ourselves faced with these two questions:- Is there life on other planets/celestial bodies?
- Is it possible to migrate to some of the celestial bodies within our reach?
Description of the Problem
Are the conditions and resources we are familiar with on Earth available on other celestial bodies in our solar system, and to what extend do these qualities make habitation possible?- Relative positioning of entities within the problem space.
- Absence or presence of favourable qualities.
- Feasibility of space colonies as a near-future research field.
- Possibility of life on other celestial bodies relative to the conditions we have determined suitable for sustaining life on Earth.
How can available data be represented in a way that is informative to a new audience or the less informed enthusiast, whilst allowing estimations to be made and answers to common questions to be inferred without affecting the integrity of the dataset.
Aim of the Visualisation
Our aim is to represent this data in a way that some of the estimations or answers to common questions can easily be inferred from the visualization.
- Minimal assumptions on the viewer's knowledge.
- Effectively use visual concepts to address common queries
- Express more using less by using symbols, contrasts, visual rhetorics and parodies
- Maintain dataset integrity by avoiding data modification.
- Tackle dimensionality without occluding individual entities and properties.
- Provide both a Global and multiple local views within the same space
Input and Output Data
Input DataOverview and Analysis of Related Work
Contents
The Classic Solar System Chart Celestial Body Classification Chart Pocket Universe - iOS Mobile AppThe Classic Solar System Chart
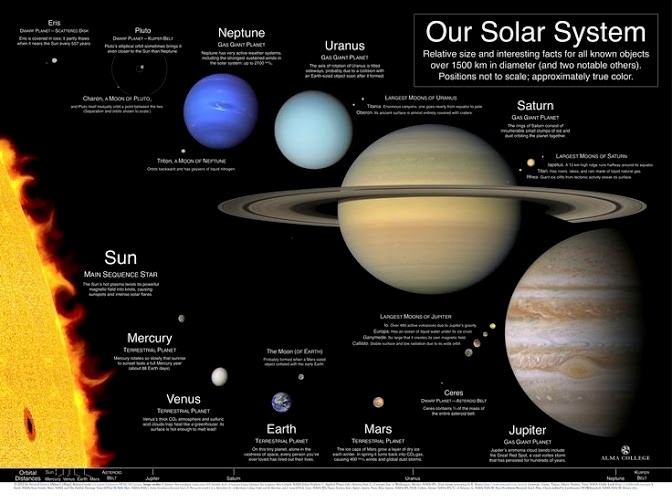
Our first review on related work was on the classic Solar System chart used in Astronomy.
This chart has stood the test of time, so we decided to analyze the positives and negatives
of this approach. The main objective of this visualization is to show all bodies within the Solar system,
as well as to provide a brief description of each body.
This is done well with each body standing out, visible text descriptions with emphasis on Planet/Moon names,
a clear distinction between classification of each body(planet/moon) and a good size scale such that even the smallest
body is visible with minimal effort on the viewers part.
The concepts that have been well executed include a good use of textures, making each planet distinguishable, and moons visible;
Good use of space and relative size, with bodies big enough to be visible whilst also making sure each body occupies it's own space(no occlusions);
Good foreground/background contrast resulting from the use of textures and a flat background, all the bodies stand out with a black
background, and the size and texture combination make it possible to tell planets apart, or even locate a body of interest over time without having
to read planet/moon names.
Possible improvements would be on making the chart multi-dimensional by taking symbols and depth into consideration, as well as
possibly selecting a better scale that will allow distances between bodies to be shown more accurately. The 2-Dimensional nature of
this infographic make it a less favourable choice of representation for our own visualization, but this analysis can help us in
making a more fitting visualization for our main objective.
Celestial Body Classification Chart
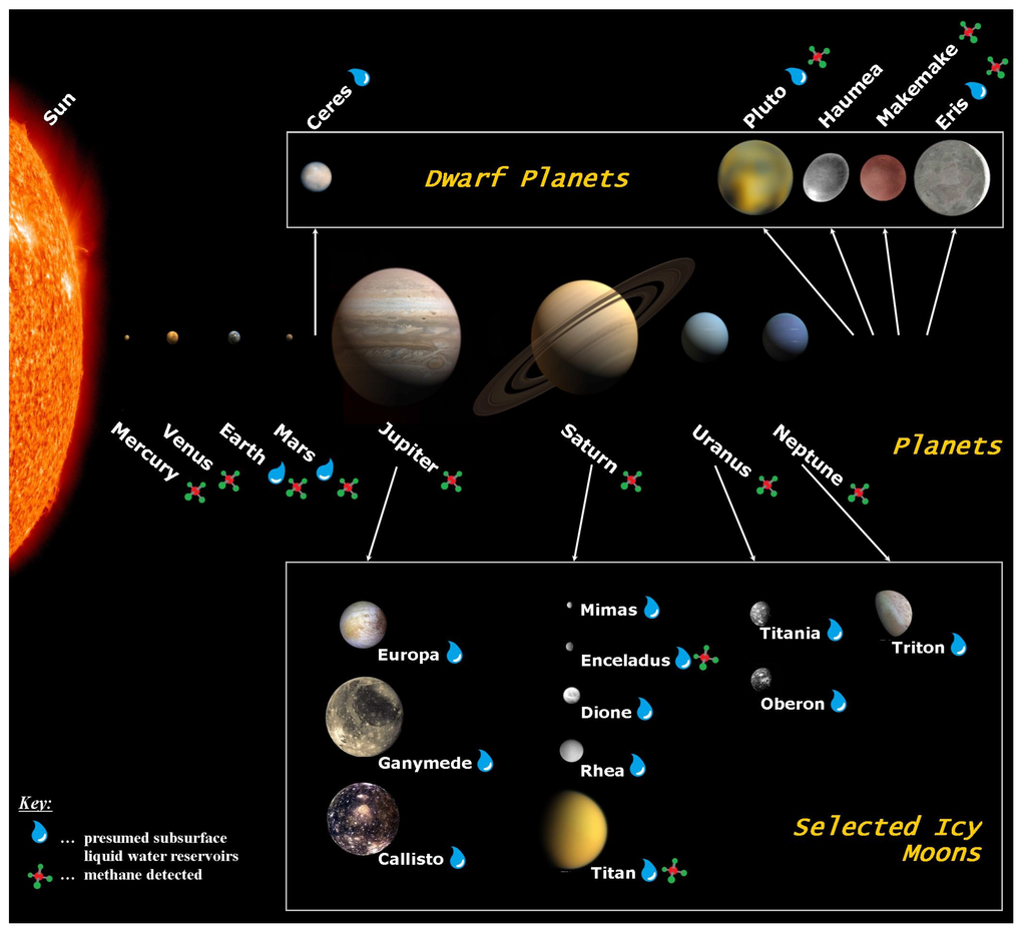 Figure 2: Infographics - Solar System Planets, Their Moons and Properties [8]
![[8]](http://www.mdpi.com/life/life-05-01652/article_deploy/html/images/life-05-01652-g003-1024.png)
Our second review was on a less conventional, and more informative chart. We consider this an improvement
on the classic solar system chart as it manages to be more visually appealing whilst also maintaining practicality and
introducing extra dimensions in the mix.
The well-done qualities included a use of visual parodies(in symbol form) to represent certain qualities of the
celestial bodies, CLassification of celestial bodies, thus showing local clustering without removing the entities themselves from
the global view, and minimal text. However, the descriptions where outright stripped and this assumes too much on the viewers knowledge of the subject matter.
Pocket Universe - iOS Mobile App
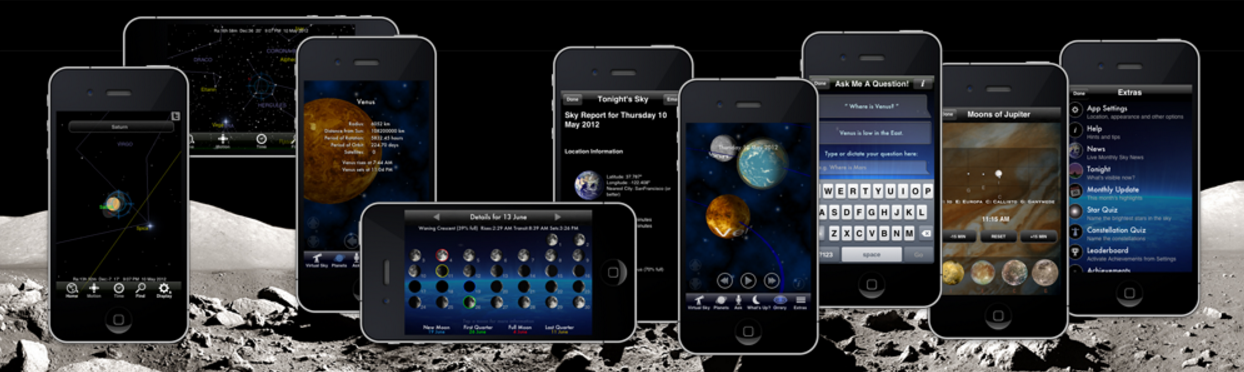 Figure 3: Mobile Apps - PocketUniverse Overview [9]
For our final review, we chose to analyze interactive alternatives to the astronomical visualizations, and our
best option was Pocket Universe for the ios platform. This had the biggest impact on our design, and it's visual effectiveness
coupled with how well it matched our feedback formed the main basis for our implementation.
Breakdown of Visual Concepts
- Global overview with more in-depth local views The main page of the app is very similar to the traditional Solar System chart, with a starry background. When a planet/moon is selected, the view zooms in with a focus on the selected body, as well as the closest bodies to it.
- Orbit visualization In the zoomed/local view, The thin orbital lines (in blue) become visible, and this aids in judging relative distance between the bodies themselves, establishing if there is a relationship between adjacent bodies (is one orbiting the other?) and the use of depth (relative size and shading) adds an extra dimension to estimate which planet is front of the other on the z axis.
- Relative size on Planets/Moons In the global view, planets/moons are sized relative to earths size, and size comparisons can be made for bodies with a large disparity in size, however, planets with similar sizes look the same size. In local views/zoom in on a body, there is a blue target mark centered at the center of a planet that allows size comparisons to be made relative to earth.
- Texture usage Each body has a unique texture for it's representation making each body differentiable from the next, and with the moons, they basically have a silverish color but where they are located and the different texture patterns make each on distinguishable even when they are close to each other. The space texture for the background has a certain feel it brings to the app, and the potential problem of stars in the background interfering with the planets in the foreground is countered by having a flatter, less coarse background for the global view(which will have smaller moons and dwarf planet depictions) and a coarser background for local/zoomed-in views where the stars cannot be misintepreted as other celestial bodies.
- Symbols The multiple views have intuitive symbols that go well with the level of information each level of viewing can present without occluding the area. There are fewer symbols for the global view as this emphasizes size and relative positioning in the Solar System, and more symbols in local views for comparison of multiple dimensions as the bodies can be represented with larger spheres, and symbols alligned along their circumference.
- Color The background and foreground contrast is effective, however, in the local views, the blue orbital lines clash with the black background and this needs to be fixed.
Visual Queries
Design
Contents
First Iteration Second Iteration Final DesignFirst Iteration
Our first iteration featured various design ideas and was intended as a starting point for further design and improvement. This design has some elements that are effective and elements that are not so effective. These are outlined in the following paragraphs.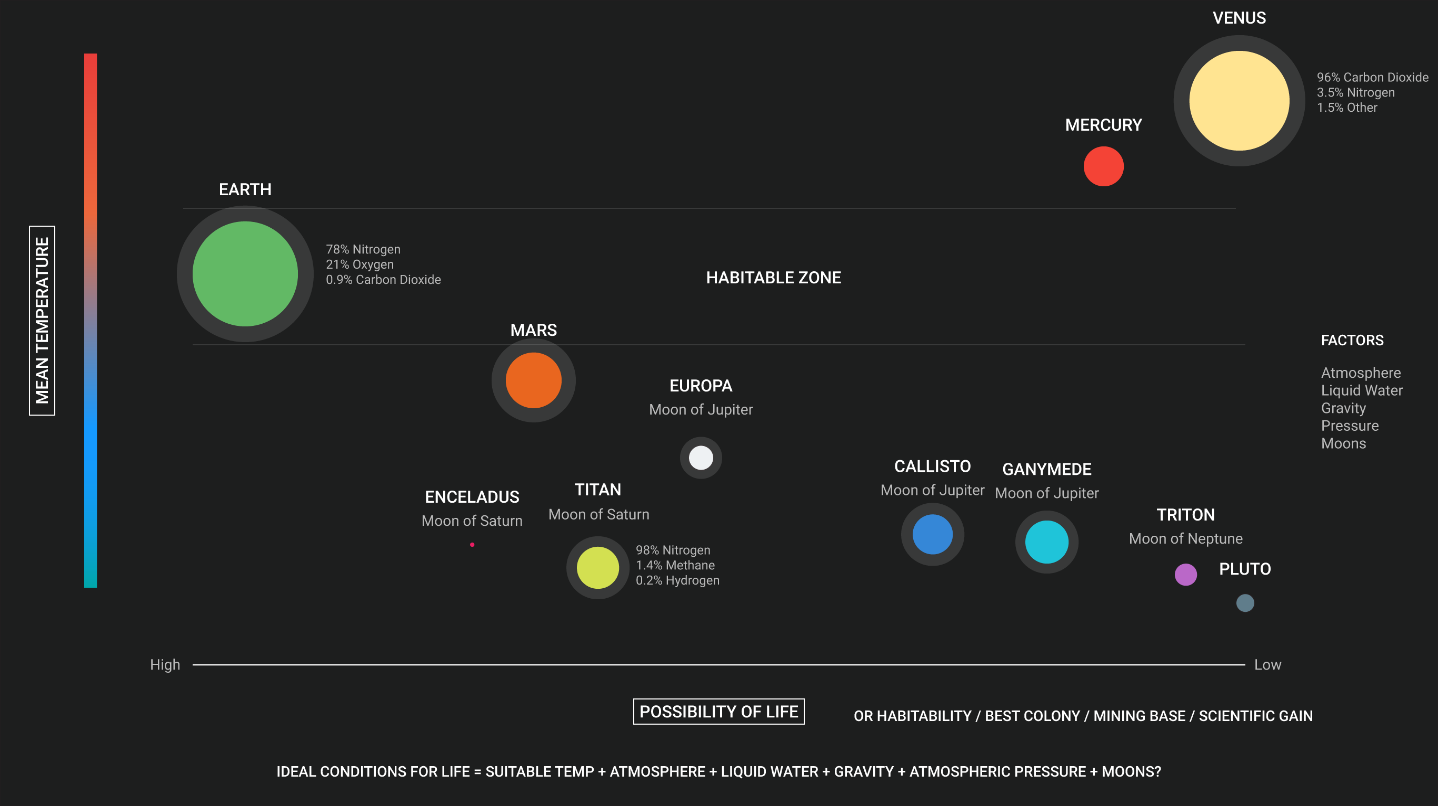
This design featured an improved scatterplot with a low luminance background colour and different colours representing each celestial body object, ensuring sufficient luminance contrast between bodies and the background in order to emphasise clarity and support visual tasks.
Celestial body objects are intended to represent two dimensions – mean diameter and the celestial body itself. This is represented using circles, with the diameter representing the celestial bodies mean diameter relative to earth’s and colour being the association for each celestial body. The celestial body object is accompanied by its name represented by a text label and a subtitle for non-planets to assist associations. The celestial body is represented using two visual feature channels to support two visual queries and also to make the object more distinct. However, colours are previously associated with celestial bodies, therefore associations will require practice.
The temperature dimension is represented on the y-axis using chromatic colour gradient with red representing high temperatures and blue representing low temperatures. This can be better represented for example there is no way to get the exact temperatures values for a specific celestial body. Colours used for associations for each celestial body might be represented as a temperature measure, e.g. a blue celestial body will be considered as a cold celestial body, leading to confusion when performing visual queries. The possibility of life dimension is represented on the x-axis. This was not accurately represented as it based on assumption, based on some criteria, and does not accurately show the real data.
Habitability factors were considered, but not included in this design. Celestial bodies with atmospheres are represented with a semi-transparent white halo around the object. Symbols are noticeably absent from this design and could’ve been used to represent the habitability factors.
Second Iteration
The second design iteration includes improvements over problems addressed in the first design iteration.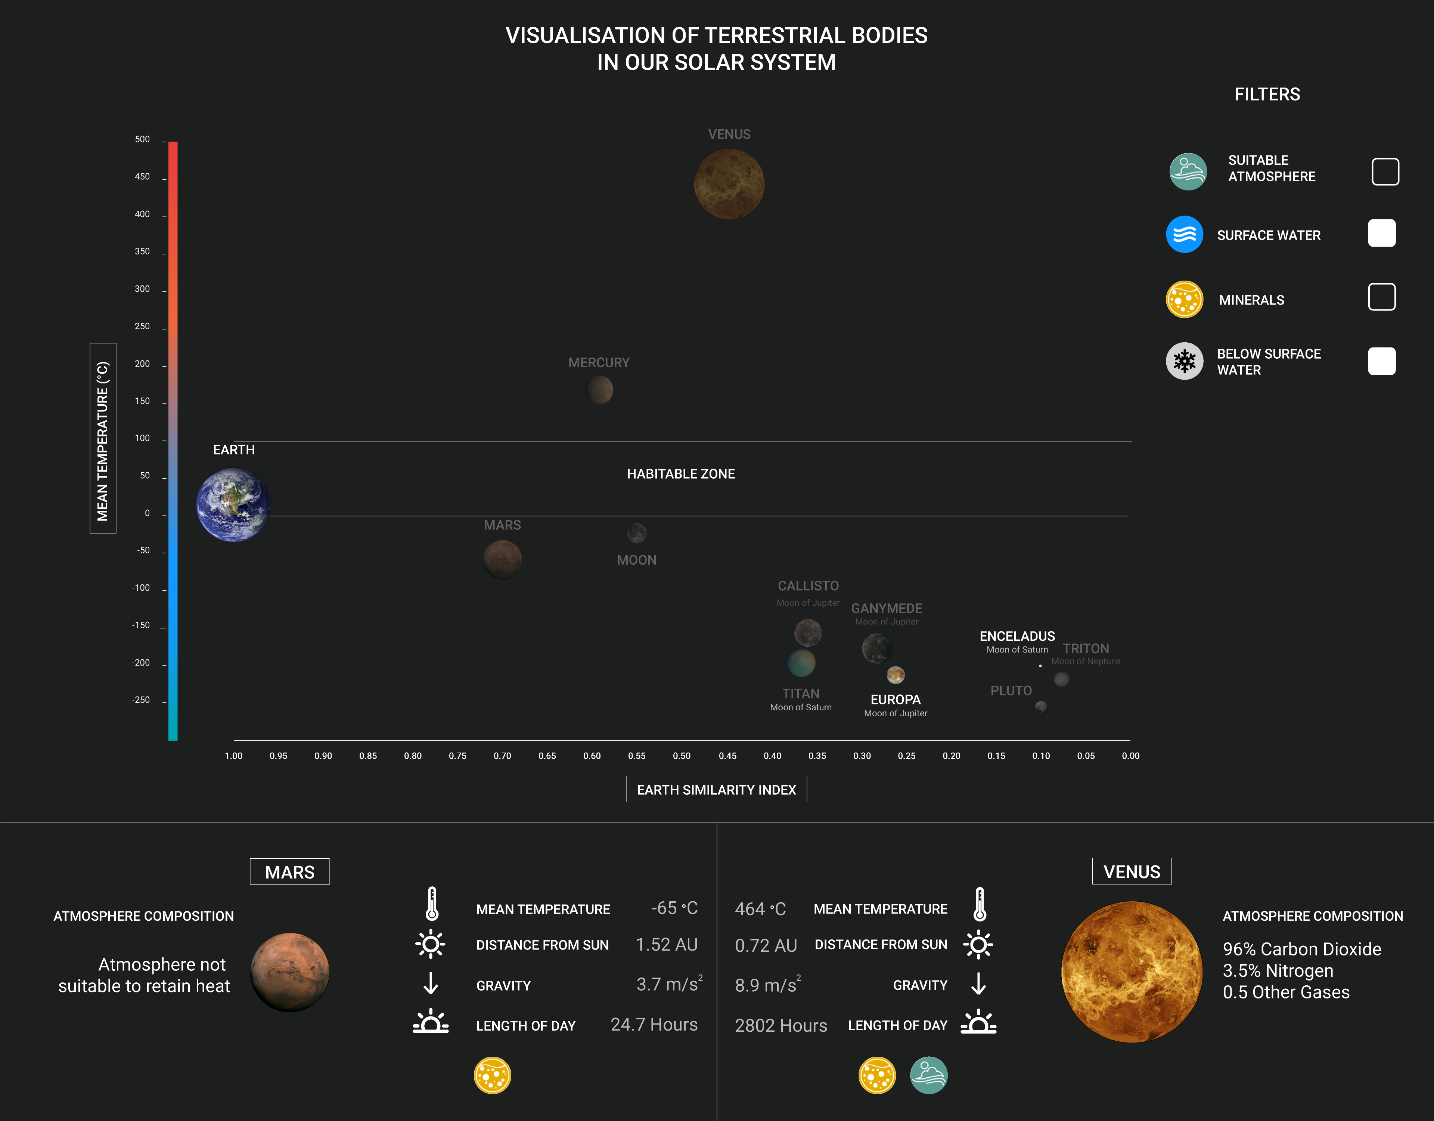
The celestial bodies are still represented with two visual feature channels, but the colour feature channel was exchanged for texture. Celestial bodies are now represented with their exterior image, as seen from space, of the planet, which allow them to be more distinct and more effectively support visual queries. The textures for certain celestial bodies such as Earth, Mars and the Moon are already familiar and are learned patterns, allowing associations to easier made and also assisting visual searches. This also solves the issue where the colour of the celestial body was being interpreted as a temperature.
The temperature gradient is also improved with temperature values allowing the exact or approximate temperature for a celestial body to be identified. A habitable zone temperature region is also included to support comparisons of celestial body temperatures with Earth’s. The possibility of life dimension represented in the previous design iteration is now replaced with real data, representing the similarity of celestial bodies compared to Earth using the Earth Similarity Index. This dimension accurately supports the visual query of comparing celestial bodies that are similar to Earth.
Habitability factors are now included and represented as symbols inside coloured circles. These are intended to be independently searchable symbols and supposed to be associated with a celestial body, when the corresponding habitability factor is checked. The symbol is also supported with a label to indicate what the corresponding symbol represents. The checkboxes allow celestial bodies to filtered out by habitability factors, by “greying out” these non-target symbols by making them more similar to the background and allowing them to be more easily excluded from the visual search.
The design also features the option to select two celestial bodies and compare them in more detail in terms of size, temperature, and distance from sun, gravity, length of day, habitability and atmosphere composition. This serves as an interactive part of the visualisation and allows more direct comparisons to be made, providing details on demand.
Feedback after presentations:- Shape can used as a third feature channel for habitability symbols e.g. squares, hexagons, circles, and triangle.
- Could explore the option of using background shading for the habitability zone.
- Show interactivity of the visualisation.
- Have possibility to use different axes. An arrow could be used for distance from sun?
- Not using depth anywhere in the visualisation.
- Use glow or a highlight box as an indicator for selected celestial bodies.
- Decide on an “OR” or “AND” for you filter.
Final Design
The final design is a more thorough design with improvements implemented from feedback received in presentations.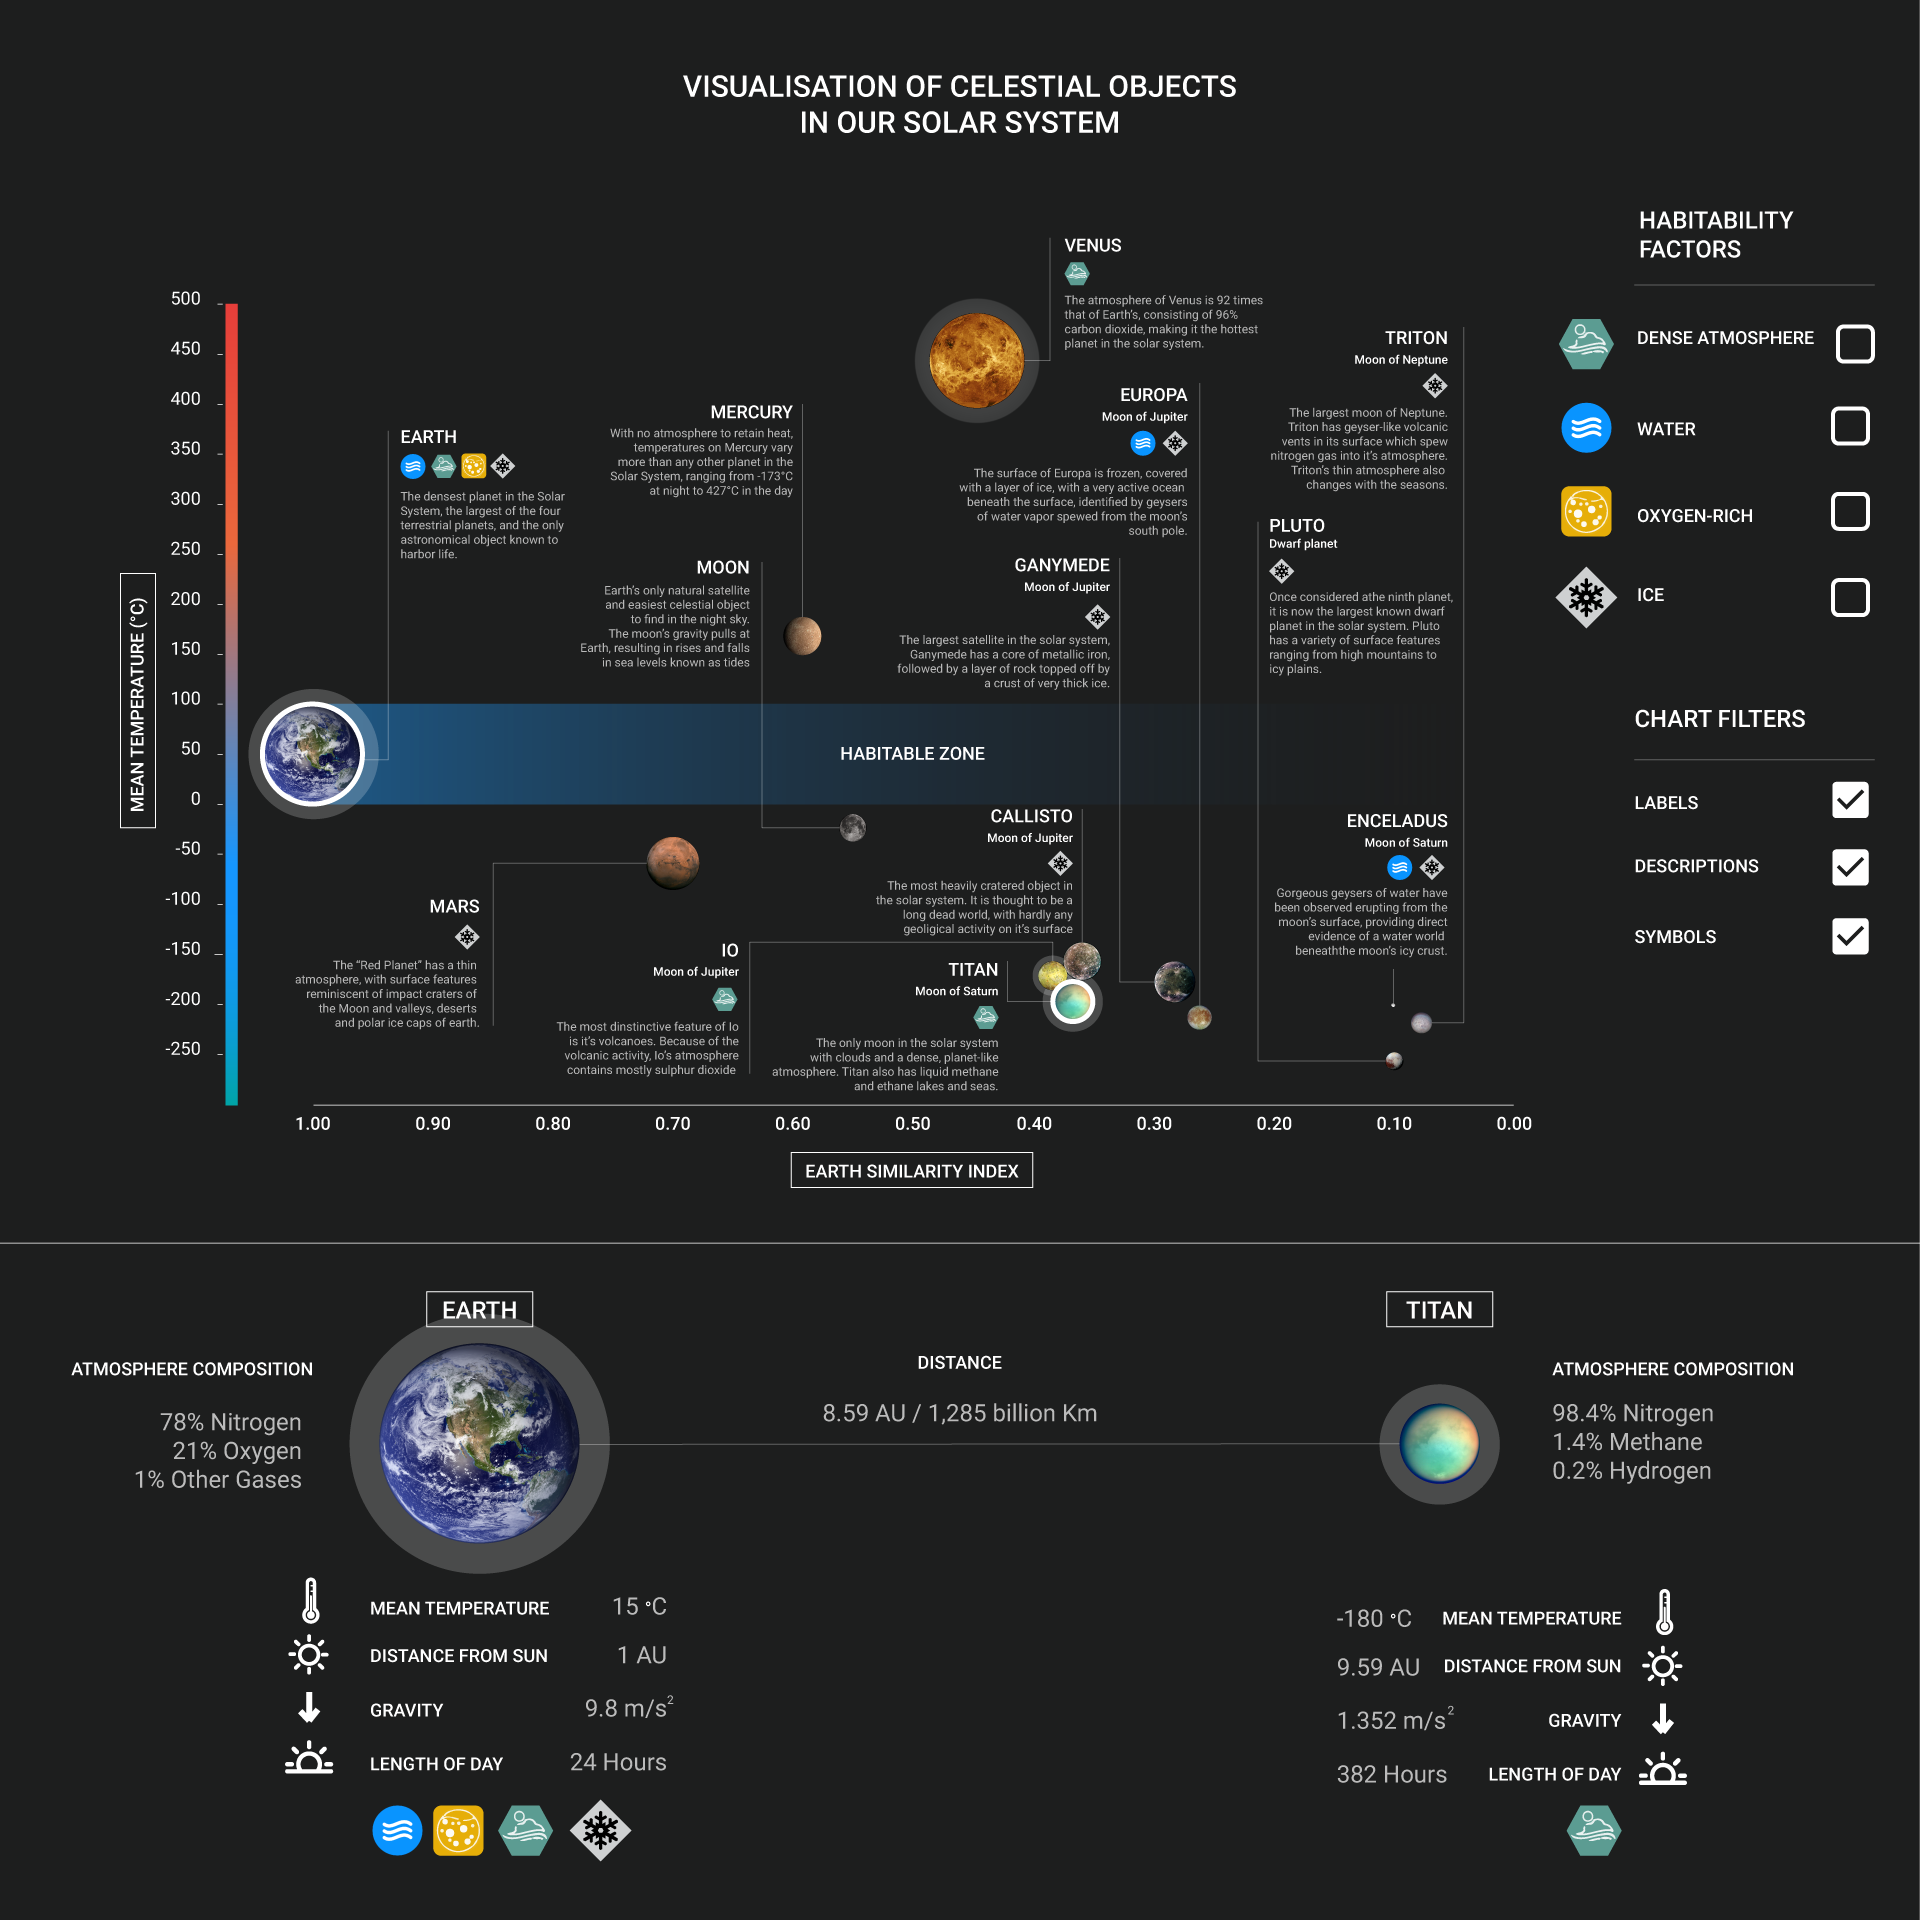
The overview of the visualisation is shown in Figure 3. The overall design from the previous iterations is still the same: Celestial bodies are displayed on an improved scatterplot, with the x-axis representing the Earth Similarity Index dimension and the y-axis representing the mean temperature in the form chromatic colour gradient with red representing high temperatures and blue representing low temperatures. For some individuals, the meaning of these colours will be immediately apparent e.g. red meaning heat, allowing them to easily make temperature comparisons of celestial bodies.
The habitable zone has been improved, as per the feedback received in the presentations. This is now represented as monochromatic colour gradient, with habitability increasing as the saturation of the colour increases. This effectively supports the visual query of comparing the habitability of celestial bodies, as different saturation of colours inherently represent quantity.
Celestial body objects are still represented on two visual feature channels: size representing the mean diameter of the celestial body and texture representing the image of the celestial body as seen from space. The image of celestial bodies make the objects more visually distinct and allow immediate associations to be made with already familiar celestial bodies such as Earth, Mars and the Moon.
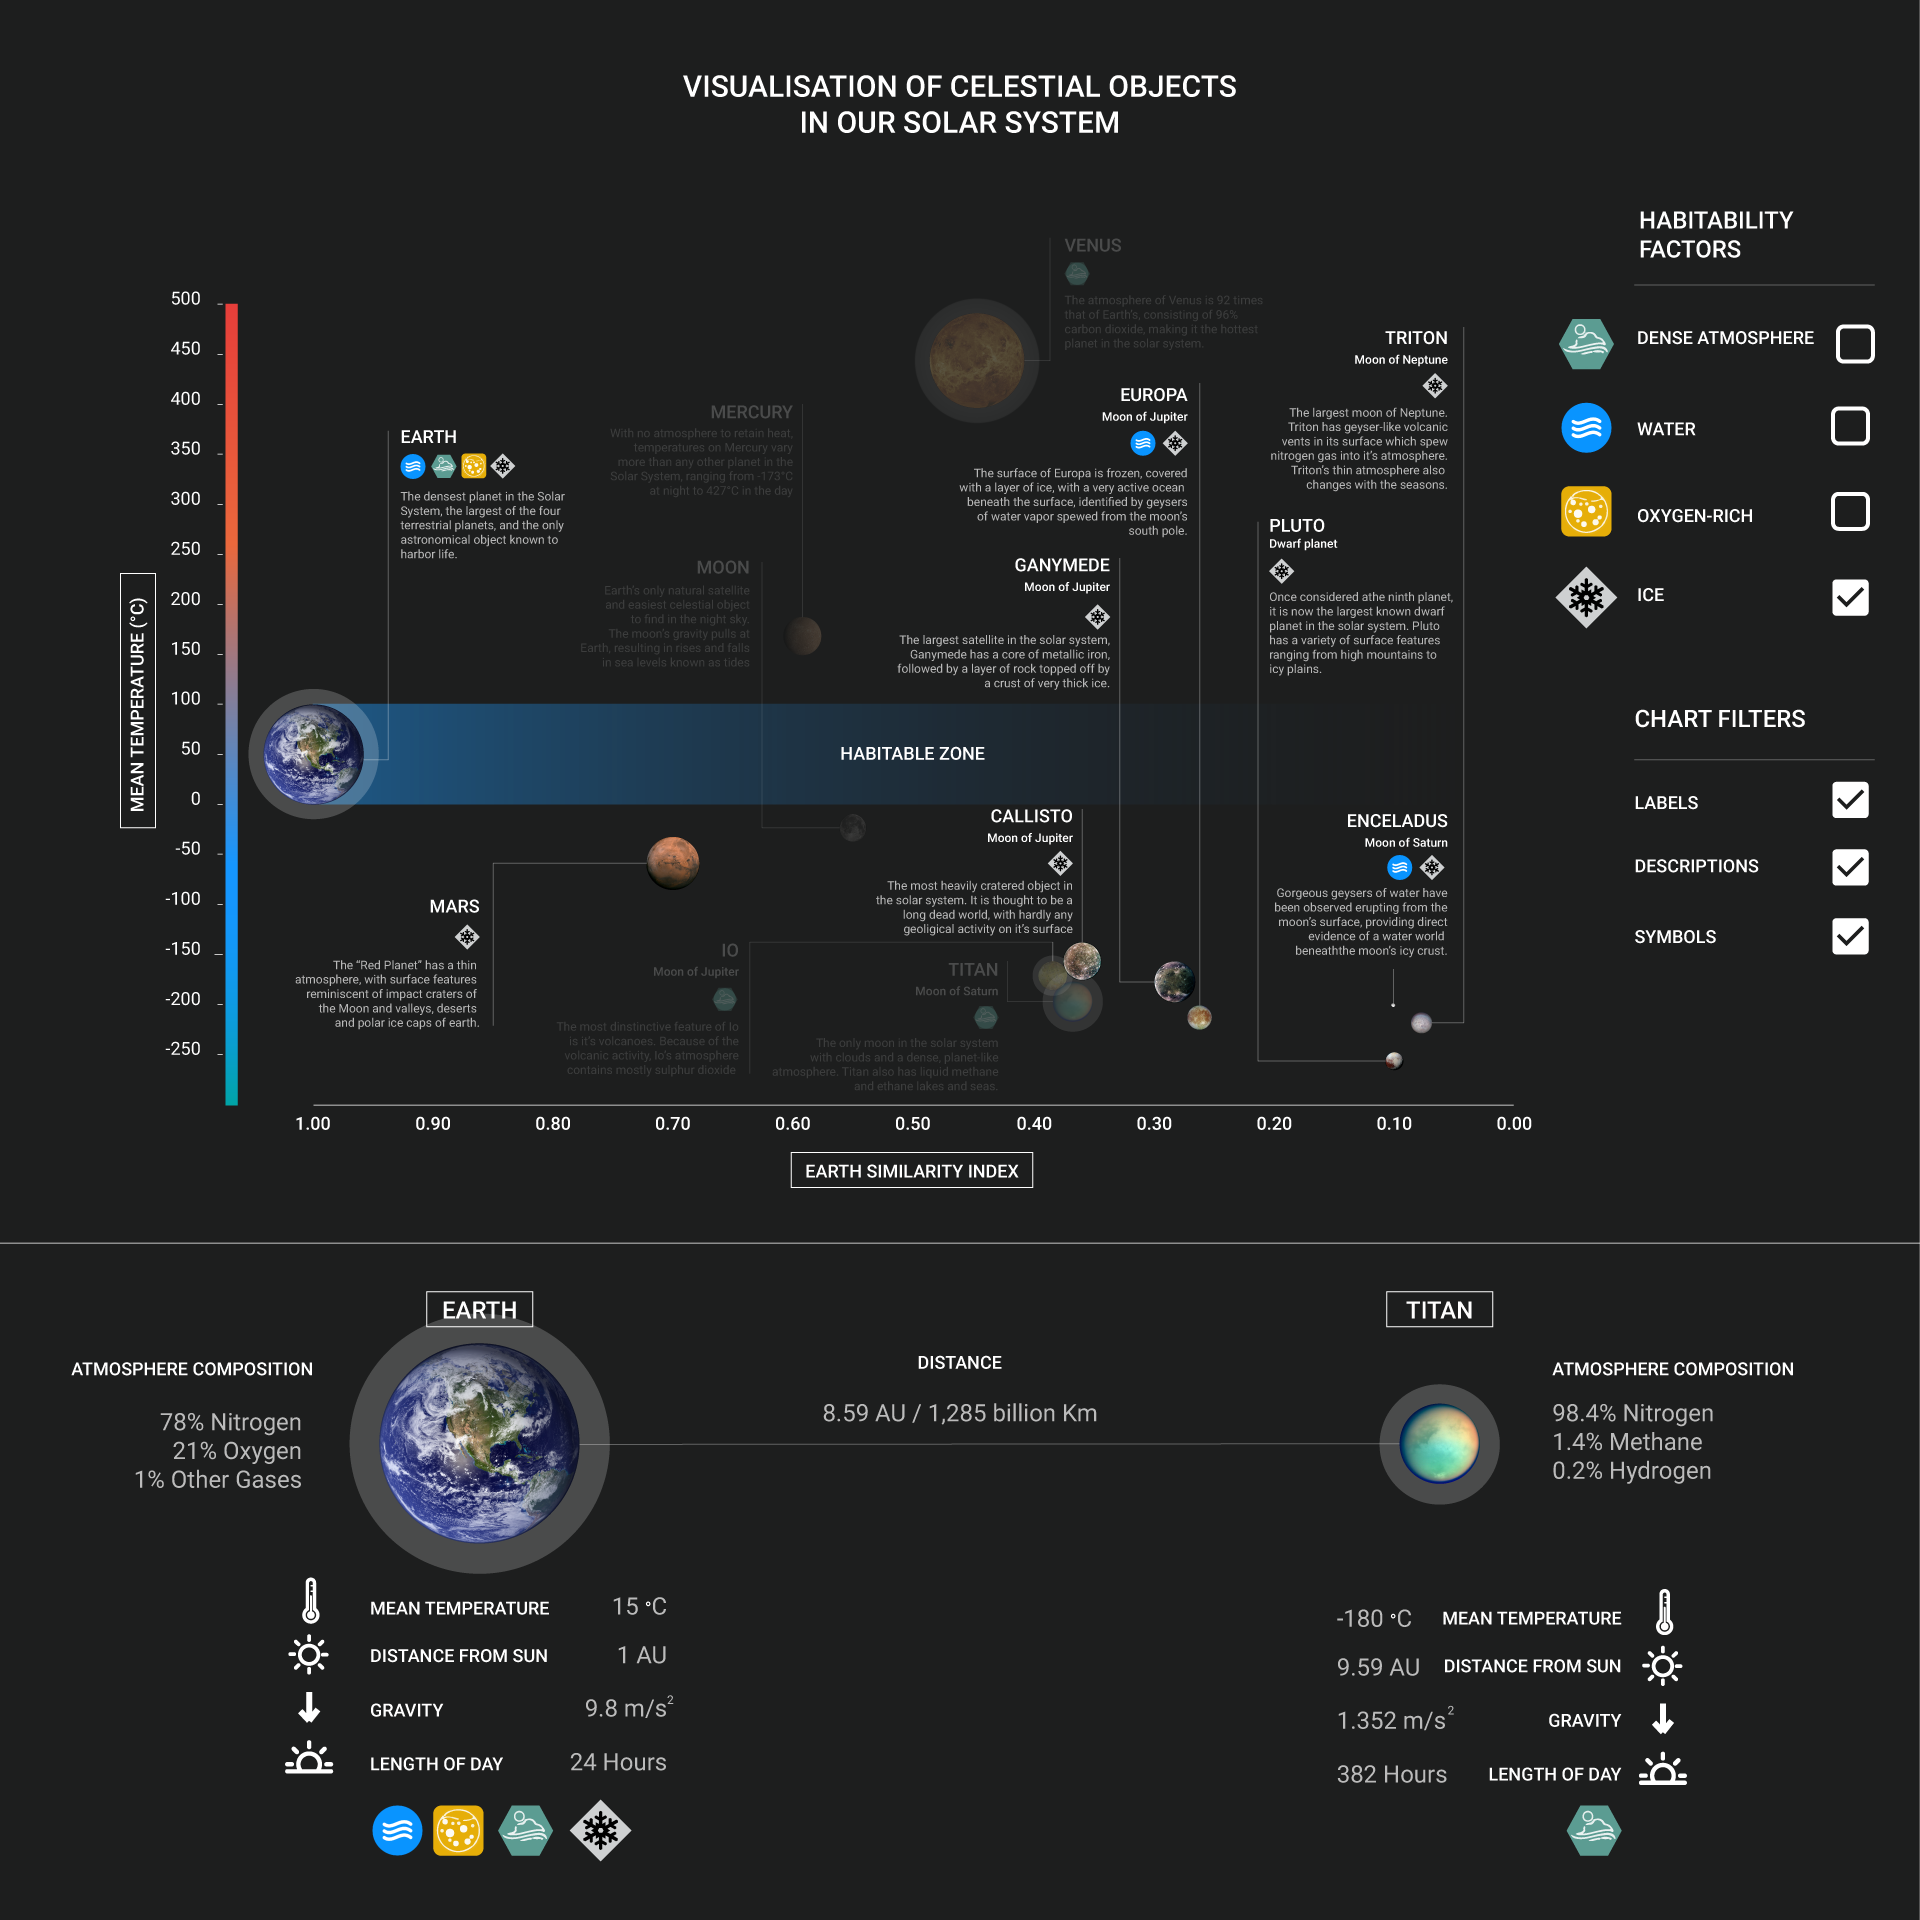
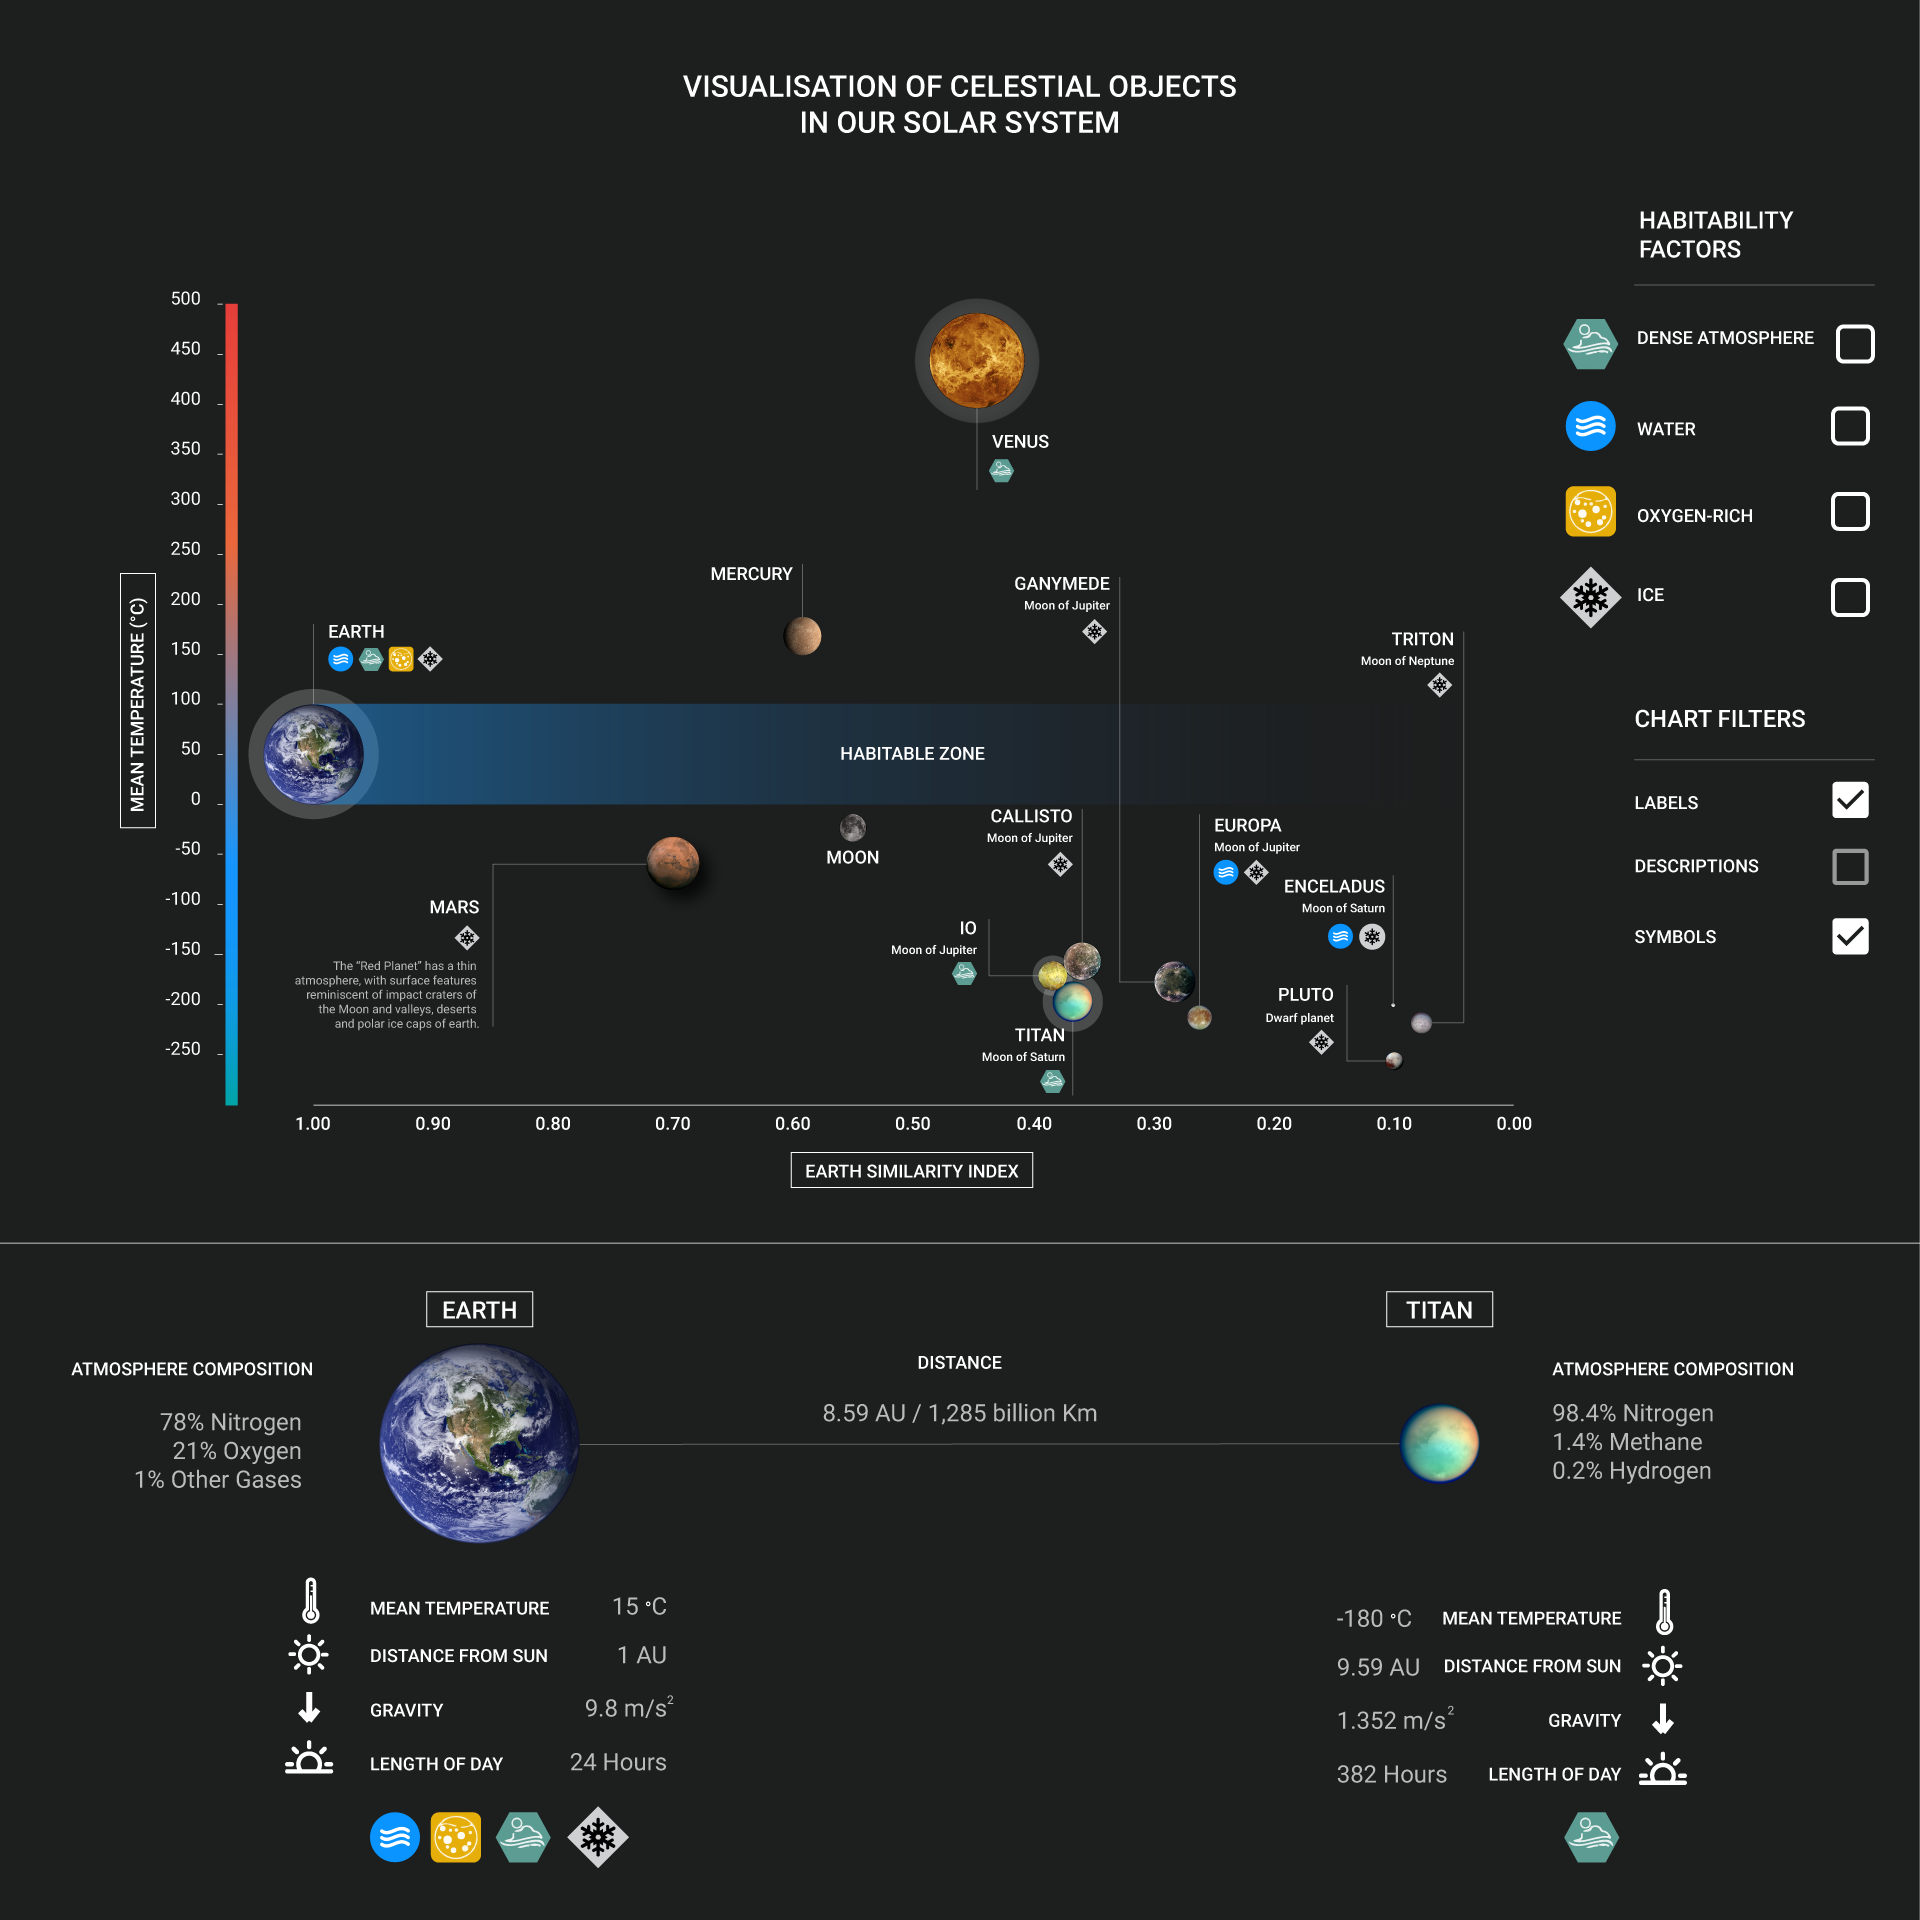
Labels for each a celestial body are a new addition. These include the name of the celestial body, symbols of its factors and a short description of the celestial body to provide more detail not included in the rest of the visualisation. These label elements can be toggled using the chart filters along the right edge of the main chart. Figure 5 shows a screenshot where the descriptions are disabled, which frees up space on the chart and allows visual queries to be more rapidly performed by excluding non-target information from the chart. Labels can still be shown when hovering over a celestial body in the case when descriptions are disabled. This interaction is shown using depth in the form of a shadow on the background as shown in Figure 5.
The symbols for habitability factors are now more visually distinct, using shape as the third dimension for the symbol. This make the symbols more independently searchable, since each symbol differs from the other on more than one feature channel. These symbols are associated with each celestial body in the label and can be toggled using the chart filter for symbols.
Celestial bodies can also be selected to allow more direct comparisons to be made with two celestial bodies. Selected celestial bodies are represented with a white ring around the object and the two selected objects are shown in the two slots in the bottom section of the visualisation as in Figure 3, providing details on demand. This allows two celestial bodies to be compared on more dimensions e.g. atmosphere composition, distance from sun, gravity and length of day, supporting more, less important visual queries. The distance between two celestial bodies is represented with the line between the two objects and displayed in both astronomical units as well as kilometres.
Celestial bodies can also be filtered out using the habitability filters as shown in Figure 4. The filter works as an AND filter, filtering out celestial bodies which don’t have all the selected habitability factors. These allow non-target celestial bodies to be excluded from visual searches by greying them out.
Strengths & Weaknesses
Strengths
Effective occuppation of space between celestial bodies through using symbols.
By displaying many dimensions on the main chart, important and frequent visual queries can be rapidly performed.
Familiar learned patterns
The images of celestial bodies make the objects more visually distinct and allow immediate associations to be made with already familiar celestial bodies such as Earth, Mars and the Moon.
Details on demand
Hovering over a celestial body provides additional information when labels are disabled and direct comparisons provide more details about two selected celestial bodies.
Independently searchable symbols
Symbols differ on at least one visual channel, allowing symbols to be easily identified.
Overview with option to filter
The filter option allows space to be effectively used, facilitating visual queries by allowing non-target symbols to be excluded from visual searches by greying them out.
Weaknesses
Cluttering and overlap of celestial bodies
Most moons have similar Earth Similarity Indices and Temperatures which certain areas being cluttered and some celestial bodies overlapping. This is due to the nature of the data and cannot be avoided with changing the visualisations main dimensions.
Size comparisons difficult
Some celestial bodies are very small relative to earth and will be difficult to recognize and just appear as a dot.
No possibility of different axes.
The visualisation doesn't allow the main chart's axes to be switched. This is to keep the focus of the visualisation on the important visual queries i.e. Mean Temperature and Earth Similarity Index support the main visual queries of comparing similarity of celestial bodies to Earth and their temperatures in order to compare their habitability.
Conclusion
The feedback received by the presentations has led to an improved design of the visualisation and allowed us to design a visualisation that allows huge quantities of data to be processed rapidly. Some issues raised during the presentations were not implemented, because we decided to keep the focus of our visualisation in line with our aim and our visual queries. The possibility of having different axes was one of the issues raised during presentations and has been addressed as a weakness of the visualisation. Another feedback point that was not implemented, was the option of having the time it will take for space travel to a specific celestial body. This was not implemented because accurate data couldn’t be found.
Work Division
Design ideas were discussed together, with both members having done analysis of existing visualisations. The initial design sketch was done by both members. The implementation for later iterations and the final design was implemented by Matthew. Pius setup the presentation slides and took the lead during presentations focusing on the introduction, aim of the visualisation and analysis of existing visualisations. Matthew focused on the explanation of design decisions during presentations.