Discussion
We think that our design clearly visualised what we wanted to display. We found a unique way of visualising the data from the theories and TV shows. Alhough we achieved what we set out to do, there are a few shortcomings.
Strengths
-Widely applicable
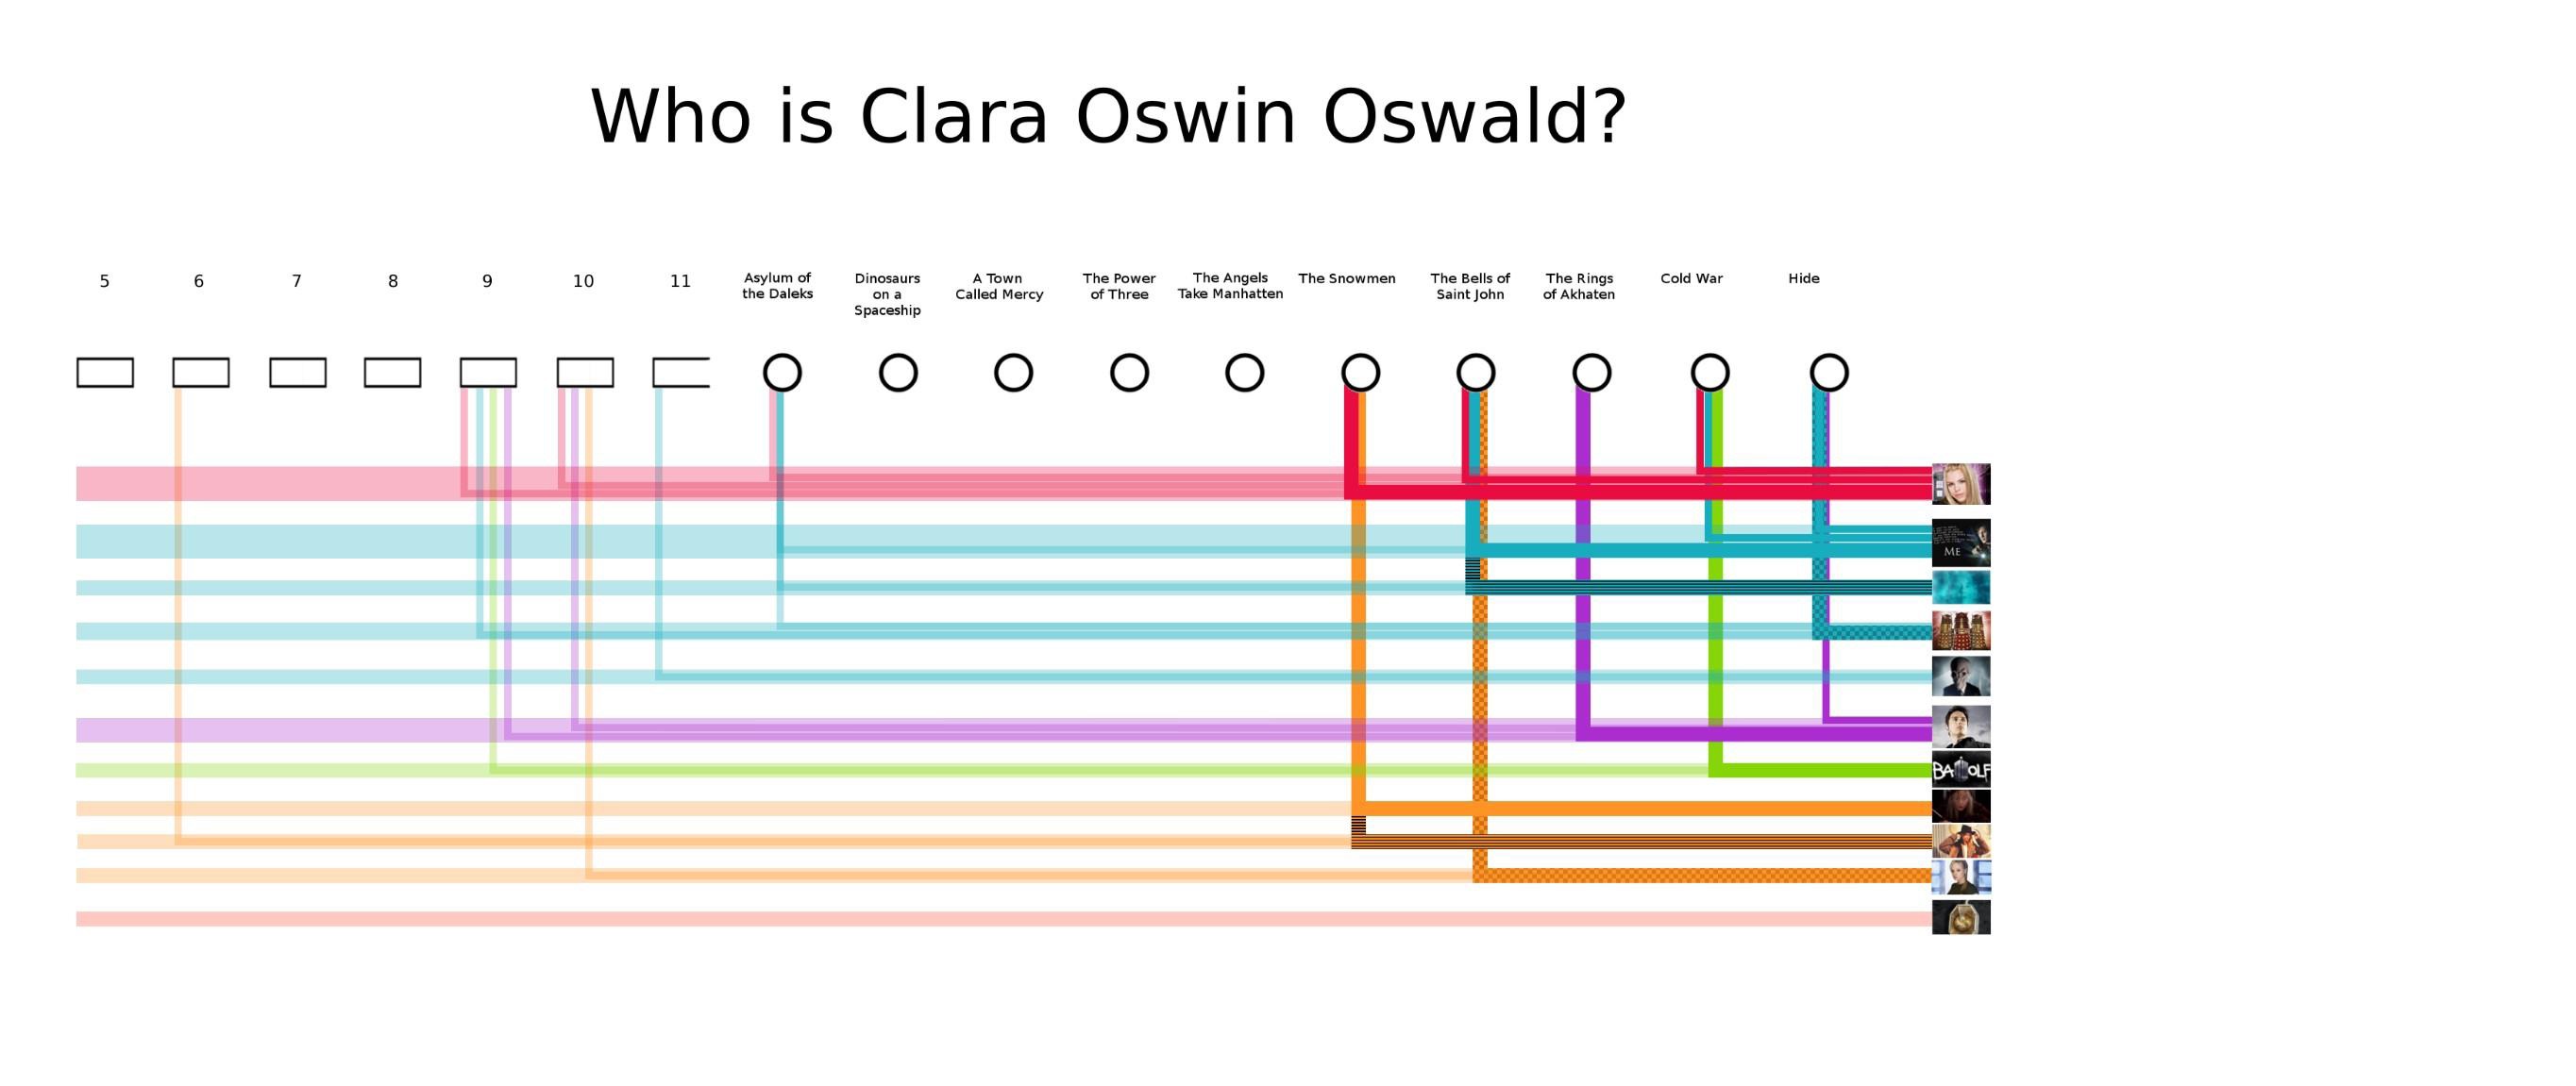
-Able to logically connect ideas by using different shades of the same colour, or different textures
-Right angles make the design clean and limit “cluttering”
-Scalable number of episodes displayed
Weaknesses
-Currently requires manual compilation of data
-There is a limit on the number of theories that can be displayed (limited by colour and the number of evidence lines that can drop down from an episode)
Conclusion and Future Work
Overall, our visualisation received a lot of positive feedback during our presentations and we were very happy with the end result. It is possible to adapt the design for many other areas, particularly areas where there are many hypotheses, such as scientific theories. It is applicable for showing different concepts and how substantiated they are. One example where this design could be used is in the comparison of theories in cancer research, where papers put forward evidence for certain theories and it is important to see which theories are the most researched or substantiated.
Future work would include dynamically drawing the visualisation based on submitted evidence. Additionally, we could include a setup phase that would remove our TV-show specific approach and allow more general visualisations to be created. This would allow a user to specify that they wanted the top circles to represent “papers” or “episodes”, and to change the terminology used in the form. These additions would then provide a visualisation generator, which wouldn’t require any knowledge of programming or image tools.
Division of Workk
Initial brainstorming was a group effort, and all design choices were critiqued by all group members.
Aurelia did a lot of the initial image creation, due to her greater experience with GIMP. Particularly, she designed all of the “Clara Theories” images. She also built the form.
Bee created the higher level view of all the TV shows and built the interactive version.
Amber made the “Once Upon A Time” images.