Introduction
Television (TV) is a popular form of entertainment for many individuals and it therefore is often a common topic for discussion. Many TV series have complicated plot lines which involve different characters and span over many episodes. These plots can develop throughout a season or even many seasons of a TV series and fans become intrigued in what will happen in the different storylines.
While the TV shows are airing, fans often attempt to guess the outcomes, of different plots, based on evidence given in episodes for those particular storylines. This is possible as TV writers frequently give hints throughout the season of how a plot might end. The more a central to a series a certain plot is, the more theories fans come up with. Fans also enjoy comparing theories and discussing the likelihood that their theories may be correct as well as sharing what evidence they think is relevant to different plotlines.
Fans post theories and the evidence for those theories on many different online platforms, such as Tumblr and Reddit and it can therefore it can be quite difficult to keep track of all the information. Our visualisation intends to display all possible theories, for different storylines, along with the relevant evidence for the theories. Fans of a series can use the visualisation to view different theories for a particular series, view specific theories for a certain plotline of a series or view evidence for theories and which episodes the evidence comes from. Ideally, fans would submit theories and the visualisation would be created automatically.
Visual Queries
Some of the queries a fan could answer using this visualisation:
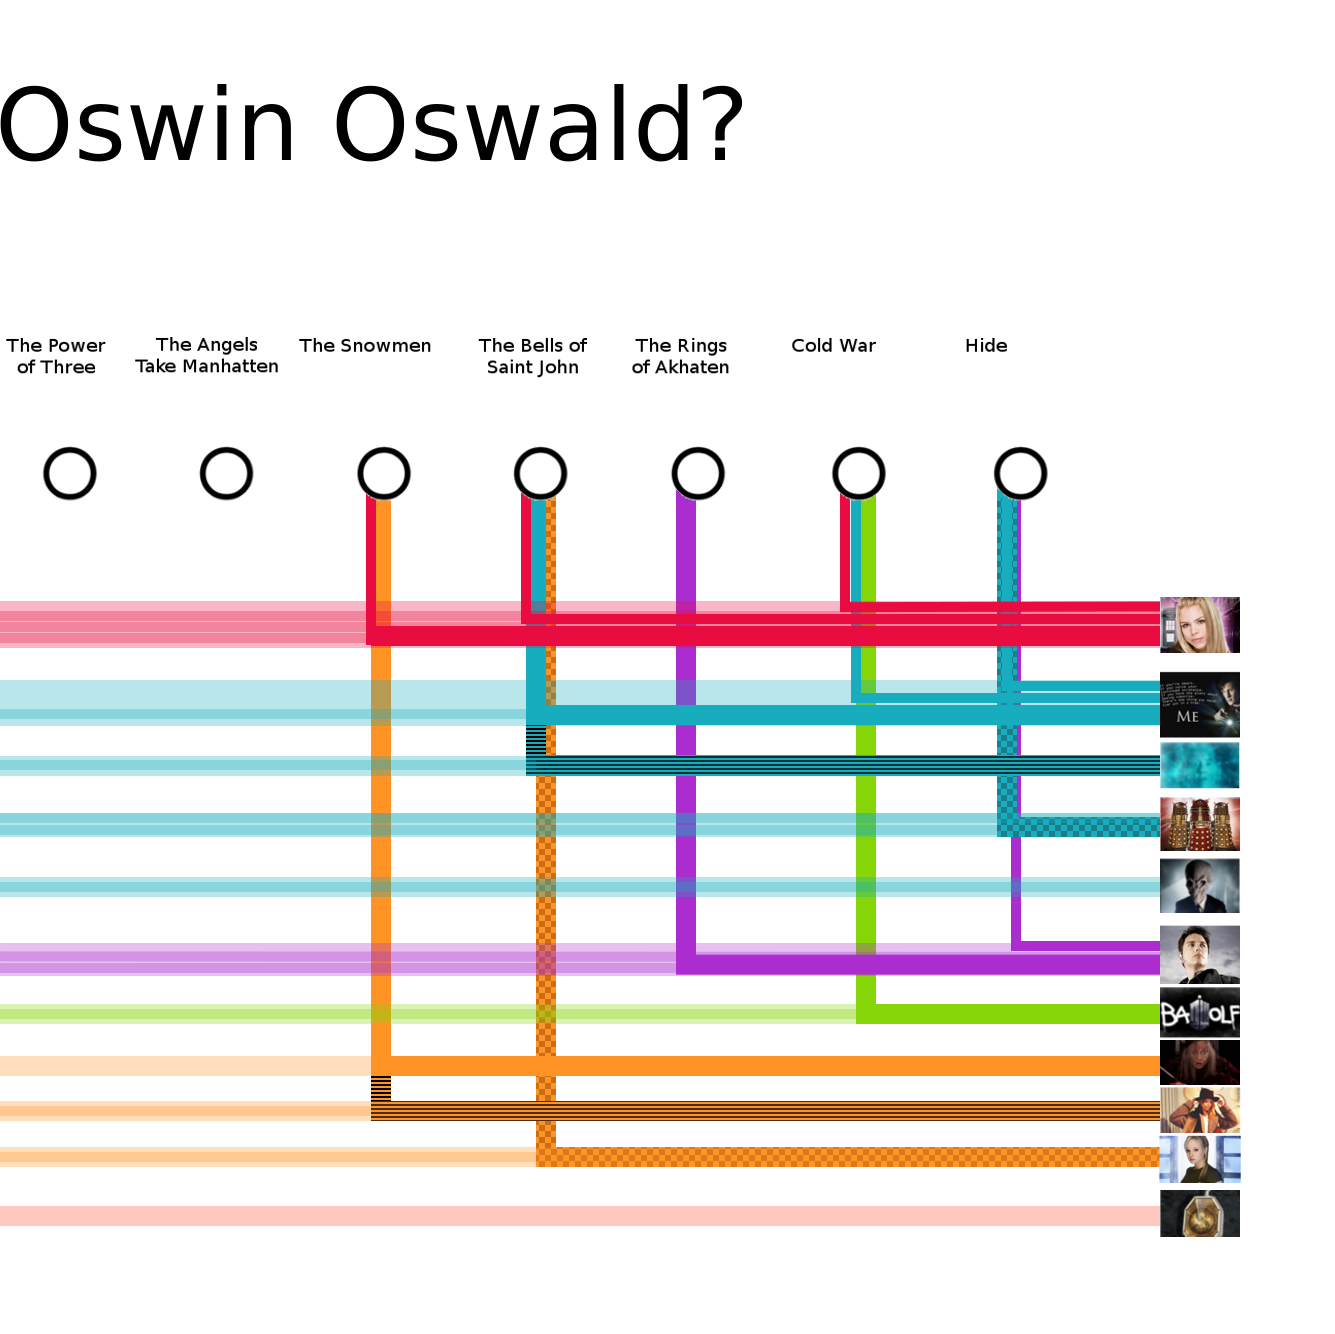
*What plotlines are being discussed in this TV series?
* Which episodes are most relevant to this plotline?
*Which theory has the most evidence?
*Which theory is the most popular?
*What evidence does a particular theory have?
*Which episodes does the evidence come from?
*Which episodes support which theories?
*What are the different theories in a TV series?
-
View a PDF of the report
-
 View The Visualisation
This is a point of entry to