Introduction
My name is Andrew van Rooyen, and this is a project for the visualisation module in my Computer Science Honours course.
We got to choose our own topics, and I found some interesting data on salary potential for different colleges in the USA. I thought that this would be interesting, and the data was really new.
So I looked around to see the ways in which people were already visualising this kind of data, and found that literally every single one was doing some kind of direct comparison. For example, there is a tool which lets you select multiple schools, and it shows you some metrics with the intention of helping you choose which one you want to go to.
So I decided to do something different, and display the data graphically. After some more looking, I found that there is one way to show 1D data on a 2D map. I'll talk more on this under "Background". Feeling brave, I chose to restrict myself to not doing it the easy way, and to come up with something interesting. I think it worked out, but you can judge for yourself.
Getting data
Payscale, the company which provides all the numbers, was very kind to have included all the data for the top 1000 schools (based on data from 2014-2015) in a javascript variable on their web page (it's called 'rows' if you're interested).
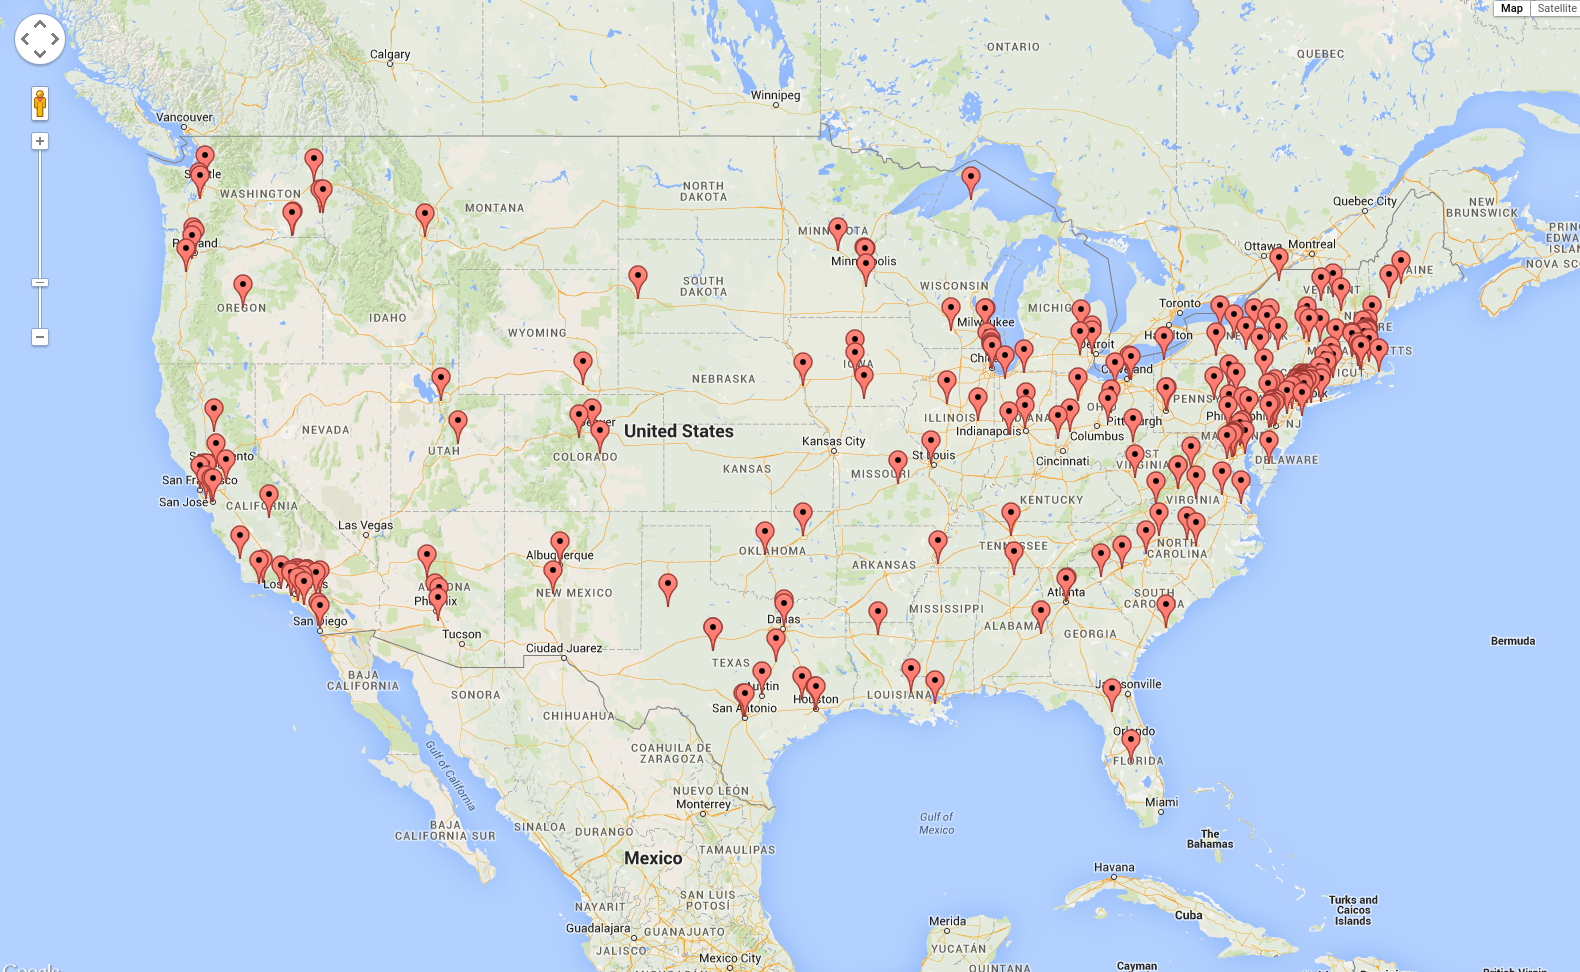
While that made my life easier, there was no geolocation attached to each school. I wanted this, because I knew that I wanted to map the locations somehow. Manually looking up the coordinates of all 1000 schools would have taken more time than any sane person would spend, so I wrote a script. I queried the Google Maps API with {School name, state, zip code}, and I soon had all the data I needed. The image on the left is my very first plot of the locations.
The links on the sidebar follow the process I took to come up with the final visualisation.